
Metal cycles and metal losses
Most uses of metals allow recycling and reuse, but in other cases, losses are almost inevitable. Metal life cycles can help to understand the sources of metal losses and to consider corrective measures, as illustrated by mercury pollution in the New York-New Jersey harbour area. Metal cycles are challenging to develop, especially for metals that are mined and used in small quantities. Close collaboration between materials scientists and resource specialists are required to ensure that criticality (that is, availability in the required amounts) is taken into account in materials development.
As with each human being, each metal has a life cycle. That for metals begins as ores are mined and processed, and continues through product fabrication, product use, and (sometimes) recycling. Imports and exports of ore concentrates, metals, and metal-containing products occur, and losses are inevitable at each transformation. When such a cycle is quantified (generally no easy task), the opportunities for better performance and that challenges that thereby need to be addressed are made much more transparent.
The majority of metal uses are such that recycling and reuse is possible, for example lead in auto batteries, steel in buildings, and copper in wires. In other cases, however, a metal is employed in such a way that its loss is almost inevitable. Examples include molybdenum in lubricants, tin in anti-fouling treatment for the hulls of ships, or zinc as a vulcanizing agent in tyres. Intermediate between these two extremes are uses in which metal could be recovered with increased effort. For a given metal, however, its assignment to one of these classifications is not always obvious.
|
These points can be illustrated by example, as shown in the nickel cycle for China for 2005 (Figure 1). In can be readily seen that imports occur at every stage from mining to manufacturing, that flows into use are some forty-five times greater than the flows out of use (a signal of a rapidly growing economy), and that there exists a moderately well-established recycling chain. In actual fact, a metal cycle analysis is much more detailed than shown here, with every major product flow being determined separately, but Figure 1 suffices to illustrate some of the benefits and possibilities.
Metal life cycles can also be useful in situations where losses to the environment are known to occur but the source of the losses is undetermined. In a classic study of this type, de Cerreño et al. (2002) set out to identify and minimize mercury pollution in the New York-New Jersey harbor area. They identified the many ways in which mercury was used, and then estimated the inputs to the harbor (Figure 2). Although the error bars for the estimates were wide, it was immediately obvious that dental facilities using mercury amalgams were almost certainly the principal source. With the principal source identified, corrective measures could be considered. |
Figure 1: The cycle of nickel in China and Hong Kong (combined) in 2005. The flows are given in units of thousand metric tons of nickel per year (Reck et al., 2008).
|
By working with dental offices, chairside mercury traps and water filtration systems were installed. The mercury inputs soon decreased and subsequently virtually ceased, as dentists, alerted to the challenge, rapidly adopted ceramic media as a replacement for mercury amalgams.
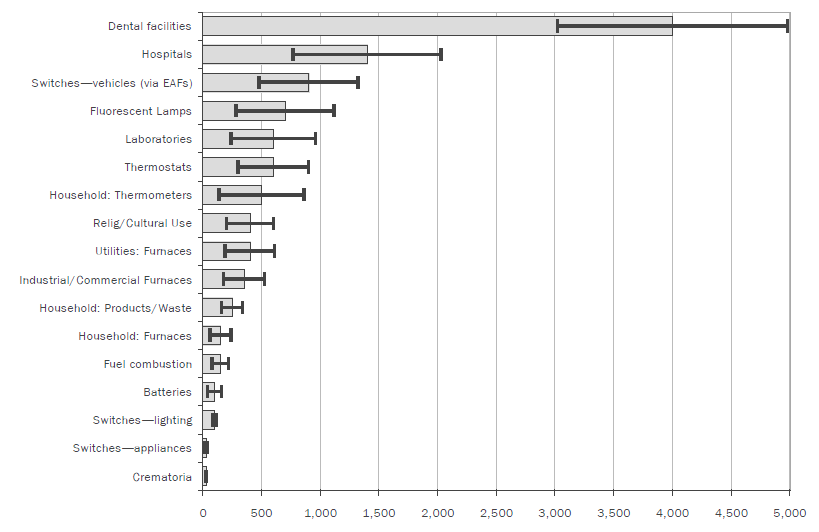
Figure 2: Estimated losses of mercury to the New York-New Jersey harbor area from identified sources in year 2000 (de Cerreño et al., 2002). The units on the abscissa are kilograms of mercury per year
The mercury story is dramatic, but also fairly representative of metal cycles in today’s world. Cycles are challenging to develop, as data are often not routinely available. Some sort of cycle has been generated for most metals (Chen and Graedel, 2012), but the cycles are well quantified for only perhaps a dozen elements. In the case of metals that are typically mined and used in small quantities, such as indium, germanium, or lutetium, current characterizations tend to be poor or nonexistent. It will not be until cycles across the periodic table are routinely constructed and updated, at different spatial levels, that we will really have a good idea of the degree to which metals are lost during and after use.
Good planetary citizenship would suggest that we can and should do better.
Stocks, flows, and losses of metals are aspects of their “criticality”, a measure of the degree to which metal importance and availability are assessed. Criticality determinations are preliminary at this time, with methodologies still to be finalized and much of the relevant data to be acquired. Nonetheless, preliminary studies (National Research Council, 2008; European Commission, 2010; Nassar et al., 2012) suggest that the biggest challenges likely lie with the scarce metals that are increasingly used in modern technologies. The routine availability of these materials in the desired amounts can no longer be assured, and materials scientists need to build closer collaborations with resource specialists so that materials choices are made in part from perspectives of criticality as well as those of physical and chemical characteristics. Doing so will not ensure that no unsettling issues will arise, but will make such a circumstance much less likely, and will thereby contribute to the robustness of our technological society as a whole.
References
W.-Q. Chen and T. E. Graedel. Anthropogenic cycles of metals: A critical review, Environmental Science & Technology, 2012, 46, 8574-8586.
A. L. C. de Cerreño, M. Panero and S. Boehme. Pollution Prevention and Management Strategies for Mercury in the New York/New Jersey Harbor, Academy of Sciences, New York: NY, 2002.
European Commission (EC). Critical Raw Materials for the EU; DG Enterprise and Industry, EC: Brussels, Belgium, 2010.
N. T. Nassar, R. Barr, M. Browning, Z. Diao, E. Friedlander, E. M. Harper, C. Henly, G. Kavlak, C. Jun, S. Kwatra, S. Warren, M.-y. Yang and T. E. Graedel. The criticality of the geological copper family, Environmental Science & Technology, 2012, 46, 1071-1078.
National Research Council. Minerals, Critical Minerals, and the U.S. Economy. National Academies Press: Washington, DC, 2008.
B. K. Reck, D. B. Müller, K. Rostkowski and T. E. Graedel. Anthropogenic nickel cycle: Insights into use, trade, and recycling, Environmental Science & Technology, 2008, 42, 3394-3400.
This article is based on a presentation by Thomas Graedel at the ECG 2013 Distinguished Guest Lecture and Symposium held in the Science Room at Burlington House on Wednesday, March 20th 2013.
Royal Society of Chemistry Environmental Chemistry Group
Burlington House
Piccadilly London W1J 0BA |
|
© COPYRIGHT 2022. ALL RIGHTS RESERVED.
Website by L Newsome
|