
Calculated tropospheric ozone changes between 2000 and 2100: the impact of climate change
Guang Zeng
National Centre for Atmospheric Science,
ECG Bulletin January 2007
National Centre for Atmospheric Science,
ECG Bulletin January 2007
Introduction
Tropospheric ozone (O3) has been a focus for tropospheric chemical research both as a regional pollutant and as an important trace gas. High ozone levels are considered harmful to human health and vegetation. Ozone is a precursor of the hydroxyl radical (OH), which plays a key role in the oxidizing capacity of the atmosphere. Ozone is also important because of its greenhouse warming potential; it currently ranks as the third most important anthropogenic greenhouse gas after CO2 and CH4.
Since pre-industrial times, anthropogenic activities have changed the chemical composition of the atmosphere considerably. Increasing surface emissions of methane (CH4), carbon monoxide (CO), volatile organic compounds (VOCs) and nitrogen oxides (NOx), produced by biomass burning and fossil-fuel combustion, have caused tropospheric O3 concentrations to increase significantly (Volz and Kley, 1988).
The total amount of tropospheric O3 is estimated to have increased by 30% globally since 1750, as reported in the Intergovernmental Panel on Climate Change (IPCC) (Houghton et al., 2001). In a response to a continuing increase of surface emissions, a further increase of tropospheric O3 is anticipated. In a changed future climate, tropospheric chemistry is likely to be perturbed. In this article we report on the computed changes of O3 between 2000 and 2100 based on the assumption of increases of precursor emissions, and explore the potential impact of climate change on tropospheric O3.
Chemistry-climate modeling
Tropospheric O3 is formed as a secondary photochemical product of the oxidation of CO and hydrocarbons in the presence of NOx. Its short chemical lifetime results in an inhomogeneous distribution and a stronger dependence on changes in trace gas emissions than other well mixed greenhouse gases. Due to the highly complex O3 chemistry in the troposphere it therefore requires a comprehensive chemical mechanism describing NOx-CO-CH4-VOC chemistry to be incorporated in three-dimensional chemistry/climate models to accurately model the global O3 distribution and to assess climate feedbacks.
To address this topic, we incorporate a detailed tropospheric chemical module into the U.K. Met Office (UKMO) climate model, the Unified Model (UM). Briefly, the UM was developed and used at the UKMO for weather prediction and climate research (Cullen, 1993). Here we use the atmosphere-only version (HadAM3) and the model’s meteorology is forced using prescribed sea surface temperatures (SSTs). It uses a hybrid sigma-pressure vertical coordinate, and the model domain extends from the surface up to 4.6 hPa. The tropospheric chemical mechanism includes 60 chemical species describing NOx-CO-CH4-NMHCs chemistry. Chemical integrations are performed using an implicit time integration scheme. The model includes dry and wet deposition of trace species. There is no explicit stratospheric chemistry in the model, therefore daily concentrations of O3, NOy, and CH4 are prescribed at the top model layers, to produce a realistic annual cycle of these species in the stratosphere.
Calculated O3 changes between 2000 and 2100
The model includes seasonally varying emissions of O3 precursors. The data set are largely based on the IPCC Special Report on Emission Scenarios (SRES) for the years 2000 and 2100 (Nakićenović et al., 2000), which makes assumptions on population growth and economic and technological development. We choose the SRES A2 scenario, which predicts relatively large emission increases, in order to assess the most pessimistic influence on future air quality. Under this scenario, the annual total CO emission increases from 1077 Tg in 2000 to 2327 Tg in 2100; and the annual total NOx emission increases from 49 to 124 Tg (N). Here, we investigate potential future ozone changes from anthropogenic emission changes, changes in meteorology and climate change induced natural emission changes of isoprene and soil-NOx. We assume twice present-day CO2 loadings to represent a future climate (2100).
|
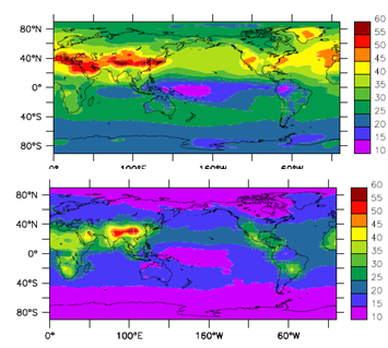
Figure 1a shows that modelled annual mean surface O3 for 2000 varies between 40-50 ppbv over large parts of Europe, Asia and North America as a direct result of emissions of O3 precursors. The background O3 levels are from 15 ppbv to 25 ppbv with the year-round low values in Central Pacific Ocean. Tropospheric O3 is not only produced in the source regions of its precursors but it is also transported to remote oceanic regions under favourable meteorological conditions. For example, the elevated O3 levels in the northern Pacific Ocean are the result of transport of pollutants from Asia.
Figure 1b shows changes in surface O3 between 2000 and 2100 assuming only changes in anthropogenic emissions, i.e., with unchanged climate. The background O3 levels are calculated to increase 10-15 ppbv by the end of this century based on the A2 emission scenario. In the Northern Hemisphere (NH), over 30 ppbv of O3 increase are calculated over polluted continents. The largest annual averaged O3 increases (over 40 ppbv) occur in Asia. The peak ozone concentration is calculated to reaching 50 ppbv in summer months. For these regions, rapid economic growth and a population increase are predicted and can lead to an unacceptable air quality. |
Figures 1a & 1b: Annual mean surface O3 for year 2000 (a) (upper panel) and ΔO3 (2100-2000) due to anthopogenic emission changes (b) (lower panel). Units in ppbv.
|
|
Increased surface emissions of O3 precursors not only contribute to O3 formation in source regions but also increase O3 levels in remote regions through long-range transport. Vertical profiles of tropospheric O3 in the year 2000 and the ΔO3 (2100-2000) are shown in Figures 2a & 2b. The Figures show the propagation of chemically produced O3 from the lower troposphere to the upper troposphere. The largest absolute increase of O3 is in the upper troposphere between 20-40οN where O3 has a longer chemical lifetime and there is no surface deposition. Note that O3 in this region has a high climate sensitivity, i.e. a larger contribution to radiative forcing to lower temperatures in the upper troposphere. There is a 75% increase in total tropospheric O3 burden as a result of increased anthropogenic emissions.
Impact of climate change Changes in meteorology can affect the O3 distribution by modifying both chemistry and transport. Figure 2c shows O3 changes due only to changes in meteorology. Feedbacks from climate change may have both positive or negative signs. Indeed, increased water vapour promotes chemical destruction especially in the tropical lower and middle troposphere, following photolysis of O3 and the subsequent reaction of O(1D) with water vapour. |
Figures 2a, 2b & 2c: Annual and zonal mean tropospheric O3 profile for 2000 (a); ΔO3 (2100-2000) due to anthropogenic emission changes (b); and ΔO3 due to climate change only (c). Units in ppbv
|
However, there are substantial increases of O3 in the lower stratosphere, which propagate to the mid-latitude troposphere. In an anticipated warmer and wetter future climate, convection lifts more rapidly O3-poor air upwards in the tropics; a strengthened Brewer-Dobson circulation transports more O3-rich air into high latitudes. This leads to an O3 reduction in the upper tropical troposphere and an O3 buildup at high latitudes in the lower stratosphere and transports into the troposphere through enhanced stratosphere-troposphere exchange (STE).. Calculations show that STE increases ~80% in a doubled CO2 future climate (Zeng and Pyle, 2003) compared with the present-day climate. In summary, future climate change have both negative and positive impact on O3 changes through intensified chemical destruction and enhanced stratosphere-troposphere exchange respectively. With climate change included, the overall feedback from the change in meteorology is slightly negative in this calculation (69% increase of tropospheric O3 burden compared to 2000).
In a changed climate biogenic emissions are likely to change. For example, elevated CO2 concentrations, increased temperature and humidity will contribute to increased emissions of isoprene from vegetation and of nitrogen species from the soil. Current estimates indicate that isoprene emissions are likely to increase by 50-80% in a double-CO2 climate. We have adopted 50% increase in our experiment. Results show that increased isoprene emissions have little impact on the total tropospheric ozone burden. However, the spatial distribution of ozone are modified; ozone generally increases in the northern hemisphere throughout the model domain and decreases in the equatorial and southern subtropical regions.
Ozone destruction in the source regions is associated with increased ozonolysis by isoprene; this signal then propagate to higher altitudes. On the other hand, we obtain elevated ozone concentrations away from the emitting source regions and in downwind remote regions (e.g. the Indian and the Atlantic Oceans). Here, increased peroxy radicals from the degradation of isoprene contribute to ozone production in the NOx-rich environment. In remote regions, PAN chemistry plays an important role in ozone formation; PAN can transport NOx away from its source regions and contribute to ozone production in low NOx environment. We have performed a sensitivity test by increasing NOx emissions from the soil by 100% in the 2100 calculation, in line with available estimates. The result shows that increased soil NOx has a substantial positive feedback to tropospheric ozone (we achieve a 3% increase of the tropospheric burden). Further work need to be carried out based on more accurate input of soil-NOx emissions for the future climate.
Summary
We calculated tropospheric O3 changes between 2000 and 2100 based on the most pessimistic emission scenario predicted for the year 2100. The calculations show a large increase in ozone in response to increases of O3 precursor emissions, which is detrimental to the air quality. Climate change plays a significant role in modifying O3 and the oxidizing capacity of the atmosphere through both changes in circulation and perturbations in chemistry. Rigid emission control is urgently needed to improve air quality and to combat climate change.
Acknowledgement
This work was supported by the National Centre for Atmospheric Sciences (NCAS). The UK Met Office Hadley Centre is thanked for the use of the UM. I would like to thank John Pyle and Paul Young for stimulating discussions.
References
Cullen, M. J. P. The unified forecast/climate model. Meteorol. Mag., 1993, 122, 81-94.
Houghton, J. T. et al (eds.), Climate Change 2000: The Scientific Basis, Cambridge University Press, UK, 2001.
Nakićenović, N. et al, Special Report on Emission Scenarios, Cambridge University Press, UK, 2000.
Volz, A.; Kley, D. Evaluation of the Montsouris series of ozone measurements made in the nineteenth century. Nature, 1988, 332, 240-242.
Zeng, G.; Pyle, J. A. Changes in tropospheric ozone between 2000 and 2100 modeled in a chemistry-climate model. Geophys. Res. Lett., 2003, 30, doi:10.1029/2002GL016708.
GUANG ZENG
National Centre for Atmospheric Science,
Department of Chemistry,
University of Cambridge, UK.
Web link: University of Cambridge Tropospheric Modelling Group http://www.atm.ch.cam.ac.uk/~trop-mod/trop_members.html
This article is based on a presentation by Dr Zeng at the ECG’s DGL and Symposium 2006. Colour versions of the Figures in this article may be seen on the ECG page of the RSC’s web site at http://www.rsc.org/Membership/Networking/InterestGroups/Environmental/bulletin.asp
Royal Society of Chemistry Environmental Chemistry Group
Burlington House
Piccadilly London W1J 0BA |
|
© COPYRIGHT 2022. ALL RIGHTS RESERVED.
Website by L Newsome
|