
Past and future uses for the National Soil Inventory of England and Wales
ECG Bulletin January 2009
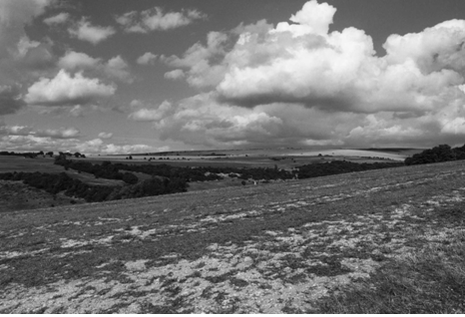 The South Downs near Pycombe, West Sussex.
Reproduced with permission of Roger Ockenden
The South Downs near Pycombe, West Sussex.
Reproduced with permission of Roger Ockenden
Many samples of soil have been collected over the past fifty years so that soils may be classified and soil maps drawn. The first systematic sampling of soil in England and Wales took place between 1978 and 1980. This soil inventory formed the basis of a soil monitoring network, and there was further resampling between 1995 and 2005. Mrs Pat Bellamy, a statistician at the Natural Resources Department, Cranfield University, describes how this unique dataset has revealed large losses of soil carbon across England and Wales, and highlights future applications of the data for the improvement of soil monitoring networks.
Sampling of soil across England and Wales
A National Soil Inventory (NSI) was conducted for England and Wales to obtain an estimate of the distribution of the soils of England and Wales and to study the chemistry of the topsoil. The whole of England and Wales was sampled at each intersection of 5 km x 5 km grids over the interval 1978 to 1983, (Loveland, 1990). Soil profiles were described and topsoil samples taken to a depth of 15cm. Each sample consisted of 25 soil cores taken on a 5 m x 5 m grid in a 20 m x 20 m plot centred on the site. The soil cores were all placed in one plastic bag and returned to the laboratory for analysis. Each sample was analysed for organic carbon, pH, metal concentrations (total and extractable Cd, Co, Cu, Mn, Ni, Pb, Zn and total Al, As, Ba, Ca, Cr, F, Fe, Hg, Mo, Na, Se, Sr, V) and nutrients (P, K, Mg). Site properties such as land use, slope and aspect were recorded.
A proportion of those sites under arable or rotational grass were resampled in 1995. Some of the permanent grassland sites were resampled in 1996, and the non-agricultural sites were resampled in 2003. Overall 40% of the original 5662 sites were resampled. The protocols which were followed for resampling were those used in the original sampling schedule. Samples and data were all archived for future use and may be seen at LandIS, the Land Information System http://www.landis.org.uk.
Changes in soil carbon
Data from the original National Soil Inventory were used to investigate the change in soil carbon over the sampling interval of 12-25 years. The results showed that carbon was lost from soils across England and Wales over the survey period at a mean rate of
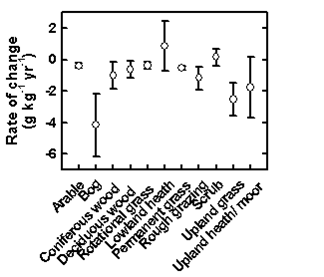
Figure 1 Annual change in carbon - grouped by land use. Data from Bellamy et al., 2005
|
Figure 2 Annual change in carbon over all land uses. Data from Bellamy et al., 2005
|
0.6% yr-1, relative to the existing soil carbon content, (Bellamy et al., 2005). Figure 1 shows the results for each land use recorded. It can be seen that only lowland heath and scrub showed an increase, and this was not a significant increase.
It was found that the relative rate of carbon loss increased with soil carbon content and was more than 2% yr-1 in soils with carbon contents greater than 100 g kg-1 (Figure 2). The equation in Figure 2 was fitted, using REML with spatial residuals, to the individual data points and was used to estimate the rate of change in soil carbon at those sites which were not resampled.
Using the estimated annual change in carbon content across the whole of England and Wales, an estimate of the carbon stock for these two countries was made using estimates of bulk density (Howard et al., 1995). It was estimated that the soils of England and Wales are losing about 4.4 Tg yr-1 of carbon. If we assumed that the soils in Scotland and Northern Ireland are similarly losing carbon we estimated the loss of carbon from the whole of the UK was about 13 Tg yr-1. For comparison, the UK’s current industrial CO2 emission is about 150 Tg yr-1.
Potential causes of soil carbon losses
Soil carbon contents depend on rates of addition from plant growth versus rates of removal in decomposition, leaching and other soil processes, and each of these is sensitive to changes in land use, climate and other variables, (Guo et al., 2002). Various changes in land use will have contributed to carbon losses from soils across England and Wales over the survey period, both from changing agricultural uses (drainage schemes, post-war grassland conversion, increased stocking rates) and non-agricultural uses (afforestation on wet soils, increased erosion, increased burning of upland vegetation).
Over the survey period, the mean temperature across England and Wales increased by about 0.5 ºC and there were also changes in rainfall distribution (Hulme, 2002). Climate change will affect soil carbon turnover through various processes. Increases in temperature will tend to increase rates of organic matter decomposition by soil microbes, although the magnitude of this effect and differences between soils are uncertain (Powlson, 2005). Data on pH from the NSI samples have shown that soils have become more alkaline over the survey period which will also have an effect on the decomposition rate of carbon.
Current research to investigate the causes of soil carbon loss
Data on land use change or management at the NSI sites are very limited. So it is difficult to assess the effect of these influences on the changes in measured soil carbon. However, data on climate across England and Wales are available for the time between the two sampling periods. Work is currently being carried out (under an NERC project) to try to understand the reasons for this large loss soil carbon using models of soil carbon turnover validated using the NSI data.
Also, as the UK is committed under the United Nations Framework Convention on Climate Change and the EU Monitoring Mechanism to produce national inventories of emissions by sources and removals by sinks of greenhouse gases, methane, nitrous oxide, Defra are funding a project to deliver the data for annual inventories and projections into the future for Land Use, Land Use Changes and Forestry (LULUCF). As part of this project we are investigating the possibility of obtaining land use and management information from other sources to investigate the causes of changes in soil carbon at the NSI sites.
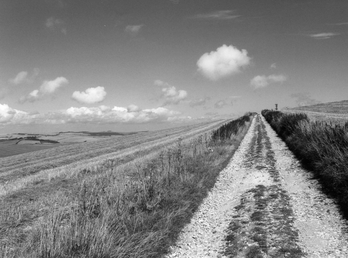 The South Downs near Pycombe, West Sussex.
Reproduced with permission of Roger Ockenden
The South Downs near Pycombe, West Sussex.
Reproduced with permission of Roger Ockenden
Other research carried out using the NSI data
Data from the NSI for the Humber-Trent region in North East England were used to investigate the use of multivariate geostatistics for the problem of estimating temporal change in soil properties for soil monitoring, (Lark et al., 2006). The NSI data were combined with GBASE data (British Geological Survey, 2006) for the concentrations of cobalt, nickel and vanadium in the topsoil on two dates. While the concentration of each metal in the soil showed pronounced spatial dependence which is known to be driven by parent material, the change over time was only spatially structured for cobalt and vanadium. This showed that information on spatial variability from a single date may be a poor guide to the design of a monitoring scheme. It was also shown how the cokriging variance of the change in concentration of cobalt and vanadium depended on sampling effort and strategy. [‘Kriging’ and ‘cokriging’ are statistical tools named in honour of the geostatistician Professor D. G. Krige].
The change in these particular variables between two dates is best estimated by sampling with equal intensity at the same sites on both dates; and when resampling an existing baseline survey it is best to sample them at rather than between the original sites. This research is now supporting the design of a UK wide soil monitoring network.
References
Bellamy, P. H.; Loveland, P. J.; Bradley, R. I.; Lark, R. M.; Kirk, G. J. D. (2005), Carbon losses from all soils across England and Wales 1978 – 2003, Nature, 437, 245 – 248.
British Geological Survey (2006), Regional geochemistry of the Humber-Trent region: stream sediment, soil and stream water, BGS, Keyworth, Nottingham.
Guo, L. B.; Gifford, R. M. (2002), Soil carbon stocks and land use change: a meta-analysis, Global Change Biology, 8, 345–360.
Howard, P. J. A.; Loveland, P. J.; Bradley, R. I.; Dry, F. T.; Howard, D. M.; Howard, D.C. (1995), The carbon content of soil and its geographical distribution in Great Britain, Soil Use and Management, 11, 9–15.
Hulme, M. et al. (2002), Climate Change Scenarios for the United Kingdom: The UKCIP02 Scientific Report, Tyndall Centre for Climate Change Research, Norwich, UK. See also http://www.ukcip.org.uk/
Lark, R. M.; Bellamy, P. H.; Rawlins, B. (2006), Spatio-temporal variability of some metal concentrations in the soil of eastern England, and implications for soil monitoring, Geoderma, 133, 363–379.
Loveland, P. J. (1990), In Element Concentration Cadasters in Ecosystems, Lieth, H.; Markert, B., Eds., VCH, Weinheim, Germany, 1990, pp 73–80.
Powlson, D. S. (2005), Will soil amplify climate change? Nature, 433, 204–205.
Mrs PAT BELLAMY, BSc MSc FRSS
Statistician, Natural Resources Department, School of Applied Sciences, Cranfield University, Cranfield, Bedfordshire MK43 0AL
Email: [email protected]
Homepage: http://www.cranfield.ac.uk/sas/aboutus/staff/bellamyp.jsp
FOOTNOTE: The National Soil Inventory of England and Wales (NSI) was originally funded by MAFF (now Defra) and carried out by soil surveyors from the Soil Survey of England and Wales, which had offices across England and Wales. The Soil Survey is now named the National Soil Resources Institute and is part of Cranfield University within the Natural Resources Department. The soil samples from the original sampling were analysed in the soil laboratory at Rothamsted Research (where the Soil Survey was based). Soils from the second sampling were analysed in the soil laboratory at the Silsoe campus of Cranfield University which was the home of the Soil Survey from 1989 – 2006. The second sampling was organised by Cranfield University and funded by Defra. The actual sampling was carried out by post-graduate students employed specifically for that task. The analytical methods and techniques for the soil samples are described by Bellamy et al. (2005). For the majority of soil samples, organic carbon was measured using the Walkley-Black method.
Cranfield University holds the archive of all the soil samples taken over the two sampling campaigns, and we hope to persuade Defra to fund another sampling for the NSI in the near future.