‘Is Goatfell higher when it rains?’ and other interesting questions from the NCAS Summer School 2008
The annual National Centre for Atmospheric Science (NCAS) Atmospheric Measurement Summer School saw PhD students from the UK and overseas travel to the Isle of Arran in Scotland. The aim of the summer school was to introduce early stage PhD students to all aspects of meteorology and atmospheric science. A group of participants from Europe and the USA look back on their scientific experiences at this year’s summer school.
The first half of the course consisted of a series of lectures covering a range of topics, from the chemical evolution and composition of the atmosphere to numerical weather prediction. The second part of the course consisted of a more practical approach – fieldwork was undertaken on Goatfell, the highest mountain on Arran; air samples were taken and analysed to determine the carbon monoxide profile of the mountain. Weather balloons were released twice daily, and weather forecasts produced each evening. The course ended with group presentations on a number of topics introduced throughout the week, some of which are discussed briefly in the rest of this article.
The first half of the course consisted of a series of lectures covering a range of topics, from the chemical evolution and composition of the atmosphere to numerical weather prediction. The second part of the course consisted of a more practical approach – fieldwork was undertaken on Goatfell, the highest mountain on Arran; air samples were taken and analysed to determine the carbon monoxide profile of the mountain. Weather balloons were released twice daily, and weather forecasts produced each evening. The course ended with group presentations on a number of topics introduced throughout the week, some of which are discussed briefly in the rest of this article.
‘Is Goatfell higher when it rains?’
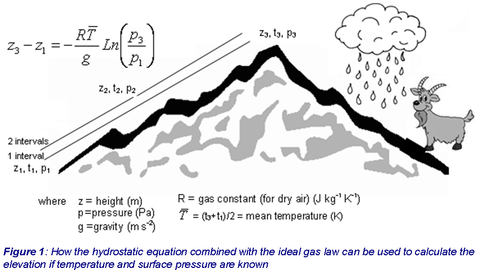
To a good approximation, atmospheric pressure varies with height according to the hydrostatic equation (Houghton, 2002). By applying the ideal gas law to this equation it can be modified to show that the difference in height between two points is proportional to the logarithm of the ratio of their pressures. This information can be used to calculate the elevation at a given location from the temperature and surface pressure recorded at that location assuming no change in synoptic pressure during the measurement period (Figure 1).
To a good approximation, atmospheric pressure varies with height according to the hydrostatic equation (Houghton, 2002). By applying the ideal gas law to this equation it can be modified to show that the difference in height between two points is proportional to the logarithm of the ratio of their pressures. This information can be used to calculate the elevation at a given location from the temperature and surface pressure recorded at that location assuming no change in synoptic pressure during the measurement period (Figure 1).
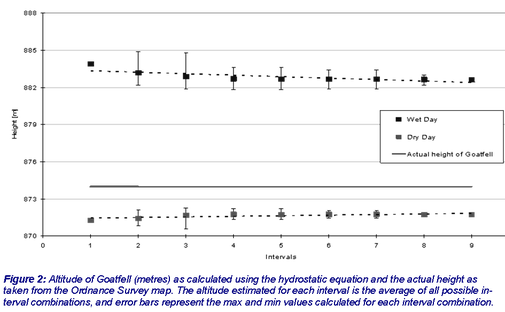
On the NCAS field course, the elevation of Goatfell was calculated using the hydrostatic equation under dry and wet conditions (see Figure 2) and the effect of increasing the number of measurement intervals used was also investigated. The results show, as expected, that increasing the number of intervals increases the accuracy to which the hydrostatic equation can calculate a given altitude as the error involved using mean temperature is reduced. Furthermore the results suggest that, in line with popular student opinion, Goatfell is actually higher when it rains!
In all reality, the overestimation of elevation of Goatfell under wet conditions probably results from using the gas constant for dry air rather than wet. The value of R will decrease for wet air thus decreasing the calculated height of the mountain.
‘It never rains on Arran, it pours …’ at least according to the WRF model
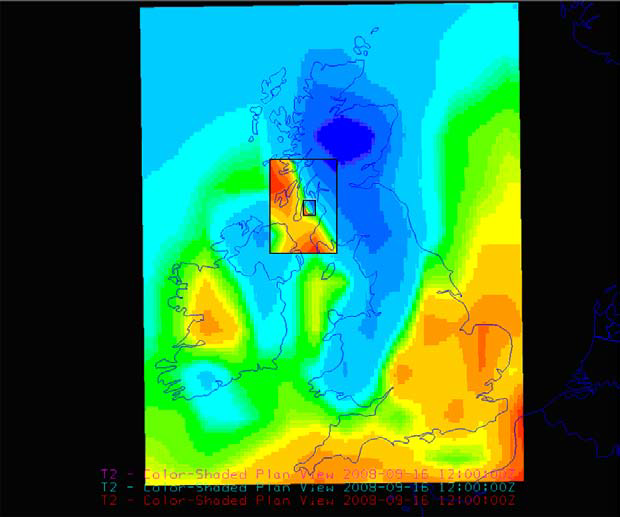
The Weather Research and Forecasting (WRF) Model is a state of the art numerical weather forecasting model developed by a collaboration of US research institutions (further details available at http://www.wrf-model.org/). It has the ability to run with nested computational grids of varying resolution, allowing the user to produce detailed forecasts for a specific location. Throughout the NCAS field course the WRF model was run daily for the Isle of Arran. Three grids were used as shown in Figure 3. The outer grid covering the UK and Ireland had a resolution of 9 km, with 3 km for the intermediate domain and 1 km for the inner one. Initial and boundary data for the daily forecasts was taken from the National Centers for Environmental Prediction (NCEP) High Resolution Global Forecast System.
The models derive anticipated values of numerous meteorological parameters, including sea-level pressure, temperature, wind speed, potential vorticity and cloud cover. These provided a useful teaching tool and could be used when preparing forecasts. The most discussed WRF output was the precipitation for 14th and 15th September as it was on these days that fieldwork, including the ascent of Goatfell, would take place. The model produced graphs that showed the expected rainfall accumulated over 2 hours, from a forecast initialised at 12 UTC on 13th September. WRF forecast that the 14th would be more suitable for outdoor activity, with dry weather expected. On 15th, a rainfall rate of roughly 2-4 mm per 2 hours was forecast. To compare the model data to actual observations a weather station was set up at the Lochranza field. As expected, the 14th was a dry day, while on 15th we see much wetter conditions, with recorded rainfall rates of between 1 and 4 mm/hour. So while this may have been a miserable day on Goatfell for some, it proved to be a success for the WRF forecasts.
Energetic Measurements
The input of energy to the Earth’s surface and its subsequent conversion and partitioning into different forms of energy is described by the surface energy balance Rn = G + H + LE (Houghton, 2002), where Rn is the net radiation input to the surface, G is the ground heat flux, H is the sensible heat flux and LE is the latent heat flux.
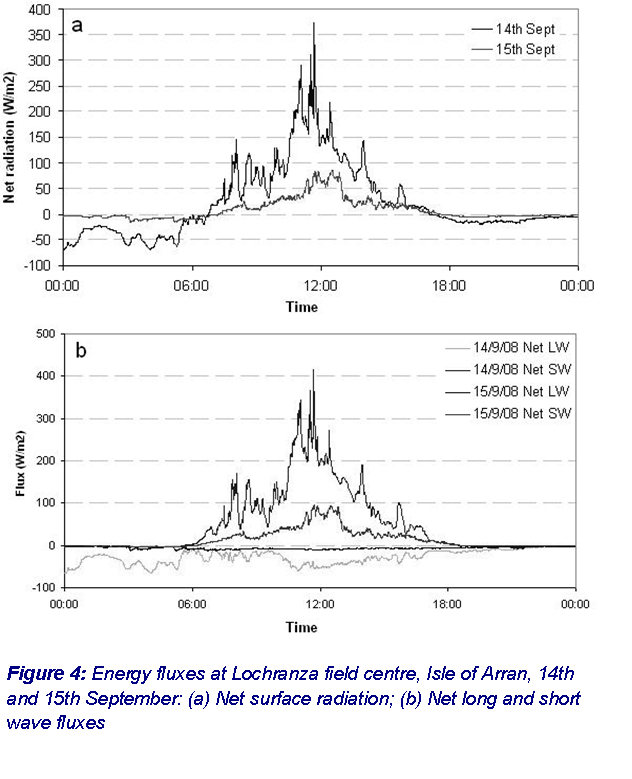
At the Lochranza field centre, the net radiation was measured by means of a radiometer and the ground heat flux using a heat flux plate buried beneath the surface. Analysis of the data collected for 14th and 15th September revealed a greater receipt of net radiation at the surface on 14th (see Figure 4a).
The net radiation describes the short wave (0.3 μm < λ < 2.0 μm) solar radiation received, absorbed and reflected at the surface and the long wave (3 μm < λ < 30 μm) radiation absorbed and emitted by both the surface and the atmosphere. When the net radiation fluxes shown in Figure 4a were decomposed into short and long wave components (Figure 4b), it was shown that on the 15th there was a lower net short wave and a higher net long wave flux than the 14th. These effects may be attributed to conditions being generally clear on the 14th, whilst the 15th was characterised by continuous cloud cover. The cloud present on the 15th is likely to have reflected and absorbed the incoming short wave radiation, thus reducing the flux at the surface. The stable net long-wave plot for the 15th implies that the atmosphere and surface are in radiative equilibrium, suggesting that the cloud layer is acting as a near-perfect black body at these wavelengths.
Profiling the CO concentration and … the hidden industry
Carbon monoxide (CO) is considered to be the most common atmospheric pollutant. The magnitude of CO concentrations is usually indicative of the air quality of a region. Major sources of CO include the burning of fossil fuels and biomass and the oxidation of methane (CH4) and other hydrocarbons. Therefore, higher concentrations of CO are expected to be found near urbanized areas, whereas in rural regions the CO levels should be low.
Carbon monoxide (CO) is considered to be the most common atmospheric pollutant. The magnitude of CO concentrations is usually indicative of the air quality of a region. Major sources of CO include the burning of fossil fuels and biomass and the oxidation of methane (CH4) and other hydrocarbons. Therefore, higher concentrations of CO are expected to be found near urbanized areas, whereas in rural regions the CO levels should be low.
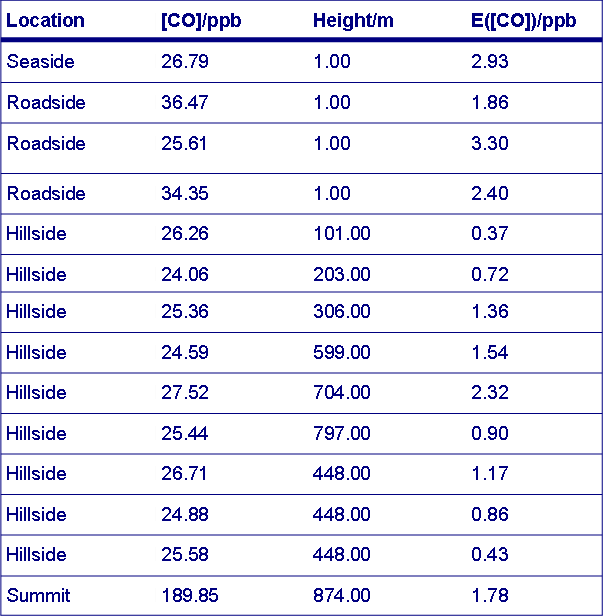
Goatfell was climbed to collect whole air samples at various altitudes. A gas pump was utilized in order to collect a total of fourteen air samples; seven at approximately every 100 m increase in altitude, three at the roadside and at an altitude of around 500 m (for cluster analysis) and one at the seaside (as a background CO reading). The obtained air samples were analysed by gas chromatography (Heard, 2006). Having calibrated the gas chromatographer, we estimated the CO concentration in our collected air samples. Table 1 summarizes the findings of our air sampling analyses.
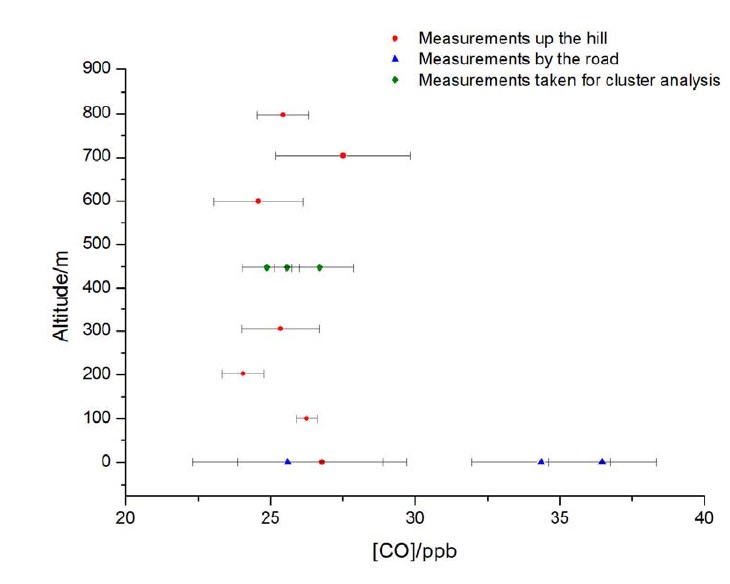
As it can be seen in Table 1, the concentration of CO in air is generally negatively correlated with the altitude. Higher concentrations are found near the surface level e.g. roadside measurements. However, there is an outlier in the data – the measurement taken on the summit of Goatfell. This concentration is so high that it could only be found if measuring near the stack of a burning chamber. Since this is not the case at the top of the mountain, we decided to consider the corresponding air sample contaminated and thus, exclude this observation from the construction of the vertical profile of CO (Figure 5).
Figure 5 illustrates the vertical profile of CO. Higher concentrations can be found near the surface, where major sources of CO are present (road transport). As we move up to the summit of Goatfell, the concentration of CO appears to slightly decrease, somehow oscillating around a value of 26 ppb. The latter level of concentration should be attributed to the presence of a background CO concentration equal to 26 ppb. This is in good agreement with the CO concentration estimated from the air sample that was collected at the seaside, a site which was chosen as representative of background CO concentration.
References
Houghton, J. T. (2002), The Physics of Atmospheres, 3rd ed., Cambridge University Press, Cambridge, 2002.
Heard, D. E. (Ed.) (2006), Analytical Techniques for Atmospheric Measurement, Wiley-Blackwell, Oxford, 2006.
Edited by Kate Faloon (University of Birmingham, [email protected]), with contributions from Emma Ferranti (Lancaster University, [email protected]), Moeko Yoshitomi (Harvard University, [email protected]), Colm Clancy (University College Dublin, [email protected]), Julia Crook (University of Leeds, [email protected]), Jonathan Kelvin (NERC Centre for Ecology and Hydrology, [email protected]), and Theodoros Giannaros (Aristotle University of Thessaloniki, [email protected]).

