
Global warming: the physical chemistry
Professor Robert Lloyd
ECG Bulletin July 2005
ECG Bulletin July 2005
Despite the widespread scientific consensus, and the partial political agreement that global warming is a serious problem which is largely man-made, there are doubters. These range from newspaper columnists who make a virtue of scientific ignorance, web pundits and even novelists, to (a few) serious climatologists who dispute subtle aspects of the modelling. In between, there seem to be some puzzled chemists, and even a few sceptical ones. Professor Robert Lloyd, formerly of Trinity College, Dublin, describes how the infra-red absorption spectra of carbon dioxide and water explain their relative importance as greenhouse gases and as contributors to global warming.
This article is an attempt to clear up some common misconceptions which arise at the relatively low level of the basic physical chemistry/physics of the infra-red (IR). In this area, we chemists may be at something of a disadvantage because of our training. We are very familiar with a part of the total IR spectrum, but the “group vibration” region, about 4000 - 1000 cm-1 (2.5 - 10 μ), is not the region of greatest importance to global warming effects. Furthermore, we have all been taught not to put too much material into our mulls or solutions; if we do, the beautiful sharp peaks turn into ugly flat-topped objects, since saturation is occurring. Such saturation is very important in understanding what is going on in global warming.
Much of the radiant energy from the sun, which approximates to a black body at 5780K, is transmitted well by the atmosphere, which is almost transparent in the visible and near-visible regions. About 30% of this radiation is reflected, mainly by clouds, and the rest warms Earth so that it too radiates, approximately as a black body. The incoming and outgoing energy reach an equilibrium position, determined by our distance from the sun. (Partial black body curves for various temperatures are shown in Figures 1 and 2). (Note 1).

Figure 1: Infra-red emission spectrum from Earth, taken at high altitude over the Sahara (Copyright American Geophysical Union). The letters on the spectrum indicate the approximate altitudes and temperatures for particular emission features: see the curve in the right-hand section. The dashed lines show the energy distributions for a black body at various temperatures.
|
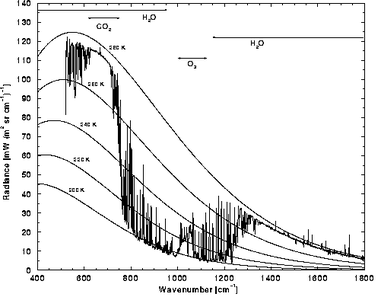
Figure 2: As Figure 1, but now on a ground-based spectrometer recording emission to Earth from the vertical column of the atmosphere, with a higher water content than in Figure 1. (Modified from a version provided on the ESPERE website).
|
In the absence of any absorption of the outgoing energy, the average equilibrium temperature of our planet would be 255K. Thus nearly all the surface of the planet would be expected to be well below the melting point of ice, so that it is at least questionable whether or not life, dependent on liquid water, could have followed the path we know (Note 2), without the additional warming which gives us the current average temperature of about 288 K.
Much of this additional warming comes from absorption of the outgoing radiation by atmospheric water vapour. Although water has strong IR absorption in the “group vibration” region, the most significant energy absorption is from the very strong and complex rotational structure between ca. 1 cm-1 and ca. 700 cm-1. The upper part of this region overlaps with the lower frequency region of the outgoing 288K black body spectrum, so that much of this energy is absorbed in the atmosphere, and then re-radiated (Note 3). Because some of this re-radiated energy is returned to earth, the net radiation reaching the surface is greater than it would be with no atmospheric absorption, and the surface temperature rises. However, obtaining quantitative estimates of the warming due to this is far from trivial. The first point to make is that there is a positive feedback effect - as the temperature rises, so does the saturation vapour pressure of water, so more water enters the atmosphere, and this produces more warming. However, not all the atmosphere is saturated (Note 4) with respect to water, so quantifying this is complex; solar reflection by clouds, the variation of cloud cover with water content, and atmospheric convection, also have to be included. Current estimates give a warming contribution due to water alone of about 20K, and about half of this comes from the “feedback” effect (Note 5).
This only accounts for two-thirds of the total warming (about 30K). The rotational absorption intensity of water falls off rapidly above about 500 cm-1, as the population of rotational levels decreases following the Boltzmann distribution. Thus the higher frequencies of the black body emission are transmitted - there is a “water window” in the atmospheric absorption which reaches up to about 1200 cm-1, where the first of the water vibration-rotation bands, associated with the bending vibration, begins. The lowest (bending) vibrational band of carbon dioxide fits into the lower frequency region of this window, and this accounts for most of the rest of the warming. Thus the “natural” or “primary” greenhouse effect is a sum of the effects of water and the natural background of about 280 ppm of CO2, with some smaller contributions from other sources (including ozone, which absorbs close to the centre of the window). For many centuries the level of CO2 was constant, as can be seen in ice-core measurements, but since about 1800 it has been increasing, and the rate of increase has also increased, giving a current (2003) level of about 375 ppm. It is the additional warming above the natural level, due to emissions from human activities, which is commonly referred to as “the” greenhouse effect.
Figures 1 and 2 illustrate some of these points (Note 6). Figure 1 is the IR emission from Earth, measured above the atmosphere at a particularly dry position - the Sahara. The Earth black body curve can be seen in the atmospheric (“ATM”) window at position C; this is being emitted from ground level. Most of the rest of the rest of the spectrum is that emitted by molecules within the atmosphere. Even in this “dry” spectrum there is a lot of water emission below 700 cm-1 and above 1300 cm-1, but since the emission is not saturated, individual components (Note 7) show as sharp peaks. This radiation comes from several km high in the atmosphere (see the right-hand graph in Fig. 1), where the temperature is much lower. The most prominent feature in the spectrum is the very strong CO2 feature from about 550 cm-1 to 800 cm-1. The broad “flat-topped” nature of the centre portion of this spectrum contrasts with the sharp peak, due to the Q branch, which is shown in most textbook (absorption) spectra. This is the result of saturation: not only is the Q branch saturated, but so are most of the wings of the adjacent P and R branches, and everything in between; in this saturated region the emission matches the high-altitude black body curve at about 218K. This energy, originally emitted at the surface, has been absorbed and re-emitted several times through successively cooler regions. The “missing energy” between the 218K and 320K curves has been returned to the surface. The spectrum also shows the re-emission of radiation absorbed by ozone in the upper atmosphere, about 2-3 km altitude, and by methane (see below).
Figure 2 shows the converse situation - a ground-based spectrometer is “looking upwards” at the downward emitted radiation, but now with more normal humidity, so the most of the water emission at wavenumbers below 550 cm-1 is at saturation, and this comes from a low altitude, temperature about 275K. Again the very intense emission between 650 cm-1 and 750 cm-1 is due to atmospheric CO2. CO2 emission is therefore returning much of the radiation emitted from Earth over a fairly wide slice, close to the maximum of the spectrum of black body radiation (Note 8).
The effects of increasing the CO2 level are not simple. It might be thought that once there is enough of any “greenhouse gas” in the atmosphere for saturation to have been reached , absorption of radiation is complete, so there could be no more warming, but this is not so. Firstly, the saturation only applies to the centre region. At the wings, increasing concentration increases the number of photons absorbed, and returned to earth. Furthermore, there is still a warming effect at the surface due to the centre of the band, because the first absorption now takes place at a lower altitude, where the temperature is higher. This energy is re-emitted, and more energy is returned to the surface. However, this is a very non-linear effect- the warming is not directly proportional to the number of molecules added, but rises more slowly. It needs to be emphasised, in view of certain media comments, that the warming effect from CO2, both natural and anthropogenic, is amplified by the water feedback mechanism, as the effect of water itself is (see above). Far from “ignoring water as a greenhouse gas” as some pundits proclaim, workers in climate modelling build this effect in to all their models. This amplification of the CO2 warming effect by water is responsible for the predicted substantial warming over the next century or so, with all the very serious consequences.
Other “greenhouse gases”, though present in much smaller amounts, make appreciable contributions because they absorb in the remaining window region where neither CO2 nor H2O absorb very strongly. Methane is significant now, but may have been catastrophic in the past. A major change in the ancient history of the Earth has been associated with warming following the decomposition of the methane-water clathrate (Note 9), and large amounts of this are known to be present now. The methane absorption band can be seen in Figure 1, though in Figure 2 it has been lost in the overlapping of the traces of many water lines. This absorption is currently well short of saturation, so warming effects are approximately linear in the number of molecules added, and per molecule, methane is about 50 times more effective than CO2, at least in the short term (upper atmosphere chemistry slowly destroys methane). As a result, methane from agriculture can be a large component of total greenhouse emissions for countries, even in the developed world, for example Ireland and New Zealand. Nitrous oxide and halocarbons also contribute to the total. As a result, despite the small concentrations of these minority species, their heating effects taken together are more than one-third of the total effect from man-made greenhouse gases (Note 10).
Clearly the “greenhouse effect” is a very intricate subject, and this short note has only attempted to deal with the very beginning of the complex process which generates climate: I hope it has been of some help, and the further reading listed below should allow access to the vast amount of real data and explanation which is available.
Notes
- These are plotted as energy density per wavenumber on a horizontal scale linear in wavenumbers. Many physics texts show curves linear in wavelength, and on these the maxima occur at different positions.
- It is also of great importance to life that one part of the solar emission is absorbed significantly by the atmosphere, the hard UV radiation, which is removed by ozone.
- In addition, there is a component from the “water bend” vibration, but there is not much of the total energy of the black body emission at these higher frequencies.
- Unfortunately, the word “saturation” is used both for the SVP and for infrared absorption, though there is no necessary connection between these uses. In the rest of this note, the word refers to saturation of IR absorption.
- See IPCC, referenced in “Further information”, Technical summary, D.1 Climate Processes and Feedbacks.
- A more dramatic version of Figure 2, in which the “window” is emphasised by colouring various sections, can be found at: www.espere.net/Unitedkingdom/water/uk_watervapour.html#x3. Similar spectra, obtained under different conditions can be found at: http://cimss.ssec.wisc.edu/aeri/science/aeriret/
- The rotational structure is very complex, and many of the apparent peaks in the figures consist of several components.
- Since the intensities at saturation are controlled by temperature, the emission envelope follows a black body curve, and information about atmospheric temperature profiles can be extracted from such spectra; see the links in note 6.
- “However, these deposits are enormous, about 107 TgC, and there is an indication of a catastrophic release of a gaseous carbon compound about 55 million years ago, which has been attributed to a large-scale perturbation of methane hydrate deposits”; see IPCC Climate Change 2001: Working Group I: The Scientific Basis 4.2.1.1.
- See IPCC: Climate Change 2001: Working Group I: The Scientific Basis 6.3.4
Further information
This article has to some extent followed the approach in A. P. Cox, “The Elements on Earth” (Oxford 1995), pp 14-19, with some amplification. IR spectra of the various molecules mentioned are available (at medium resolution) at http://webbook.nist.gov/chemistry/
Various other websites give some details on the stages by which the spectroscopic information is turned into models of the climate of the earth; one of the most detailed, which nevertheless is well-organised into links, so that particular interests can be followed through, is at http://www.aip.org/history/climate/index.html
As an introduction to this, there is a spectacular demonstration of the way in which global temperature and carbon dioxide levels have tracked each other over 160,000 years at http://www.aip.org/history/climate/xVostokCO2.htm
A site which attempts to answer individual problems is www.realclimate.org/index.php?p=1
There is a large, somewhat indigestible but authoritative collection of documents from the Intergovernmental Panel on Climate Change (IPCC) at http://www.grida.no/climate/ipcc_tar/index.htm
Within this the most directly relevant material to this note is the discussion of carbon species at http://www.grida.no/climate/ipcc_tar/wg1/095.htm and of the effects of the absorbed radiation at http://www.grida.no/climate/ipcc_tar/wg1/212.htm
Acknowledgements
I am particularly grateful to Professor Norman Sheppard, who provided advice at an earlier stage of this manuscript, and to Dr. Rob Jones of the Chemistry Department, University of Cambridge, for a detailed discussion, and for making Figure 1 available. Any remaining errors are my responsibility. I would also like to note the contributions of two Skeptical Chymists, who in extensive correspondence have forced me to clarify my own ideas on this topic.
Biographical note
In 2000, BOB LLOYD retired from the Chair of General Chemistry at Trinity College, Dublin, where he had helped to set up a new course in Environmental Chemistry. His research, (after a start in solution kinetics) has been mainly in photoelectron spectroscopy and allied methods, initially in the gas phase (at the University of Birmingham, to 1978) and later in angle-resolved form on surfaces, particularly with adsorbed molecules.